
Back to Blog bugsmash
 gemma
gemma community
 ai
ai ai
ai githubactions
 ai
ai
My benchmark's Python column was N/A for a year — CPython's 4300-digit limit, and eight other bugs
xbill July 15, 2026
0 views
Submission for DEV's Summer Bug Smash — Clear the Lineup track. The...
title: "My benchmark's Python column was N/A for a year — CPython's 4300-digit limit, and eight other bugs" published: true series: Bugs tags: bugsmash, python, go, debugging
Submission for DEV's Summer Bug Smash — Clear the Lineup track.
The codebase
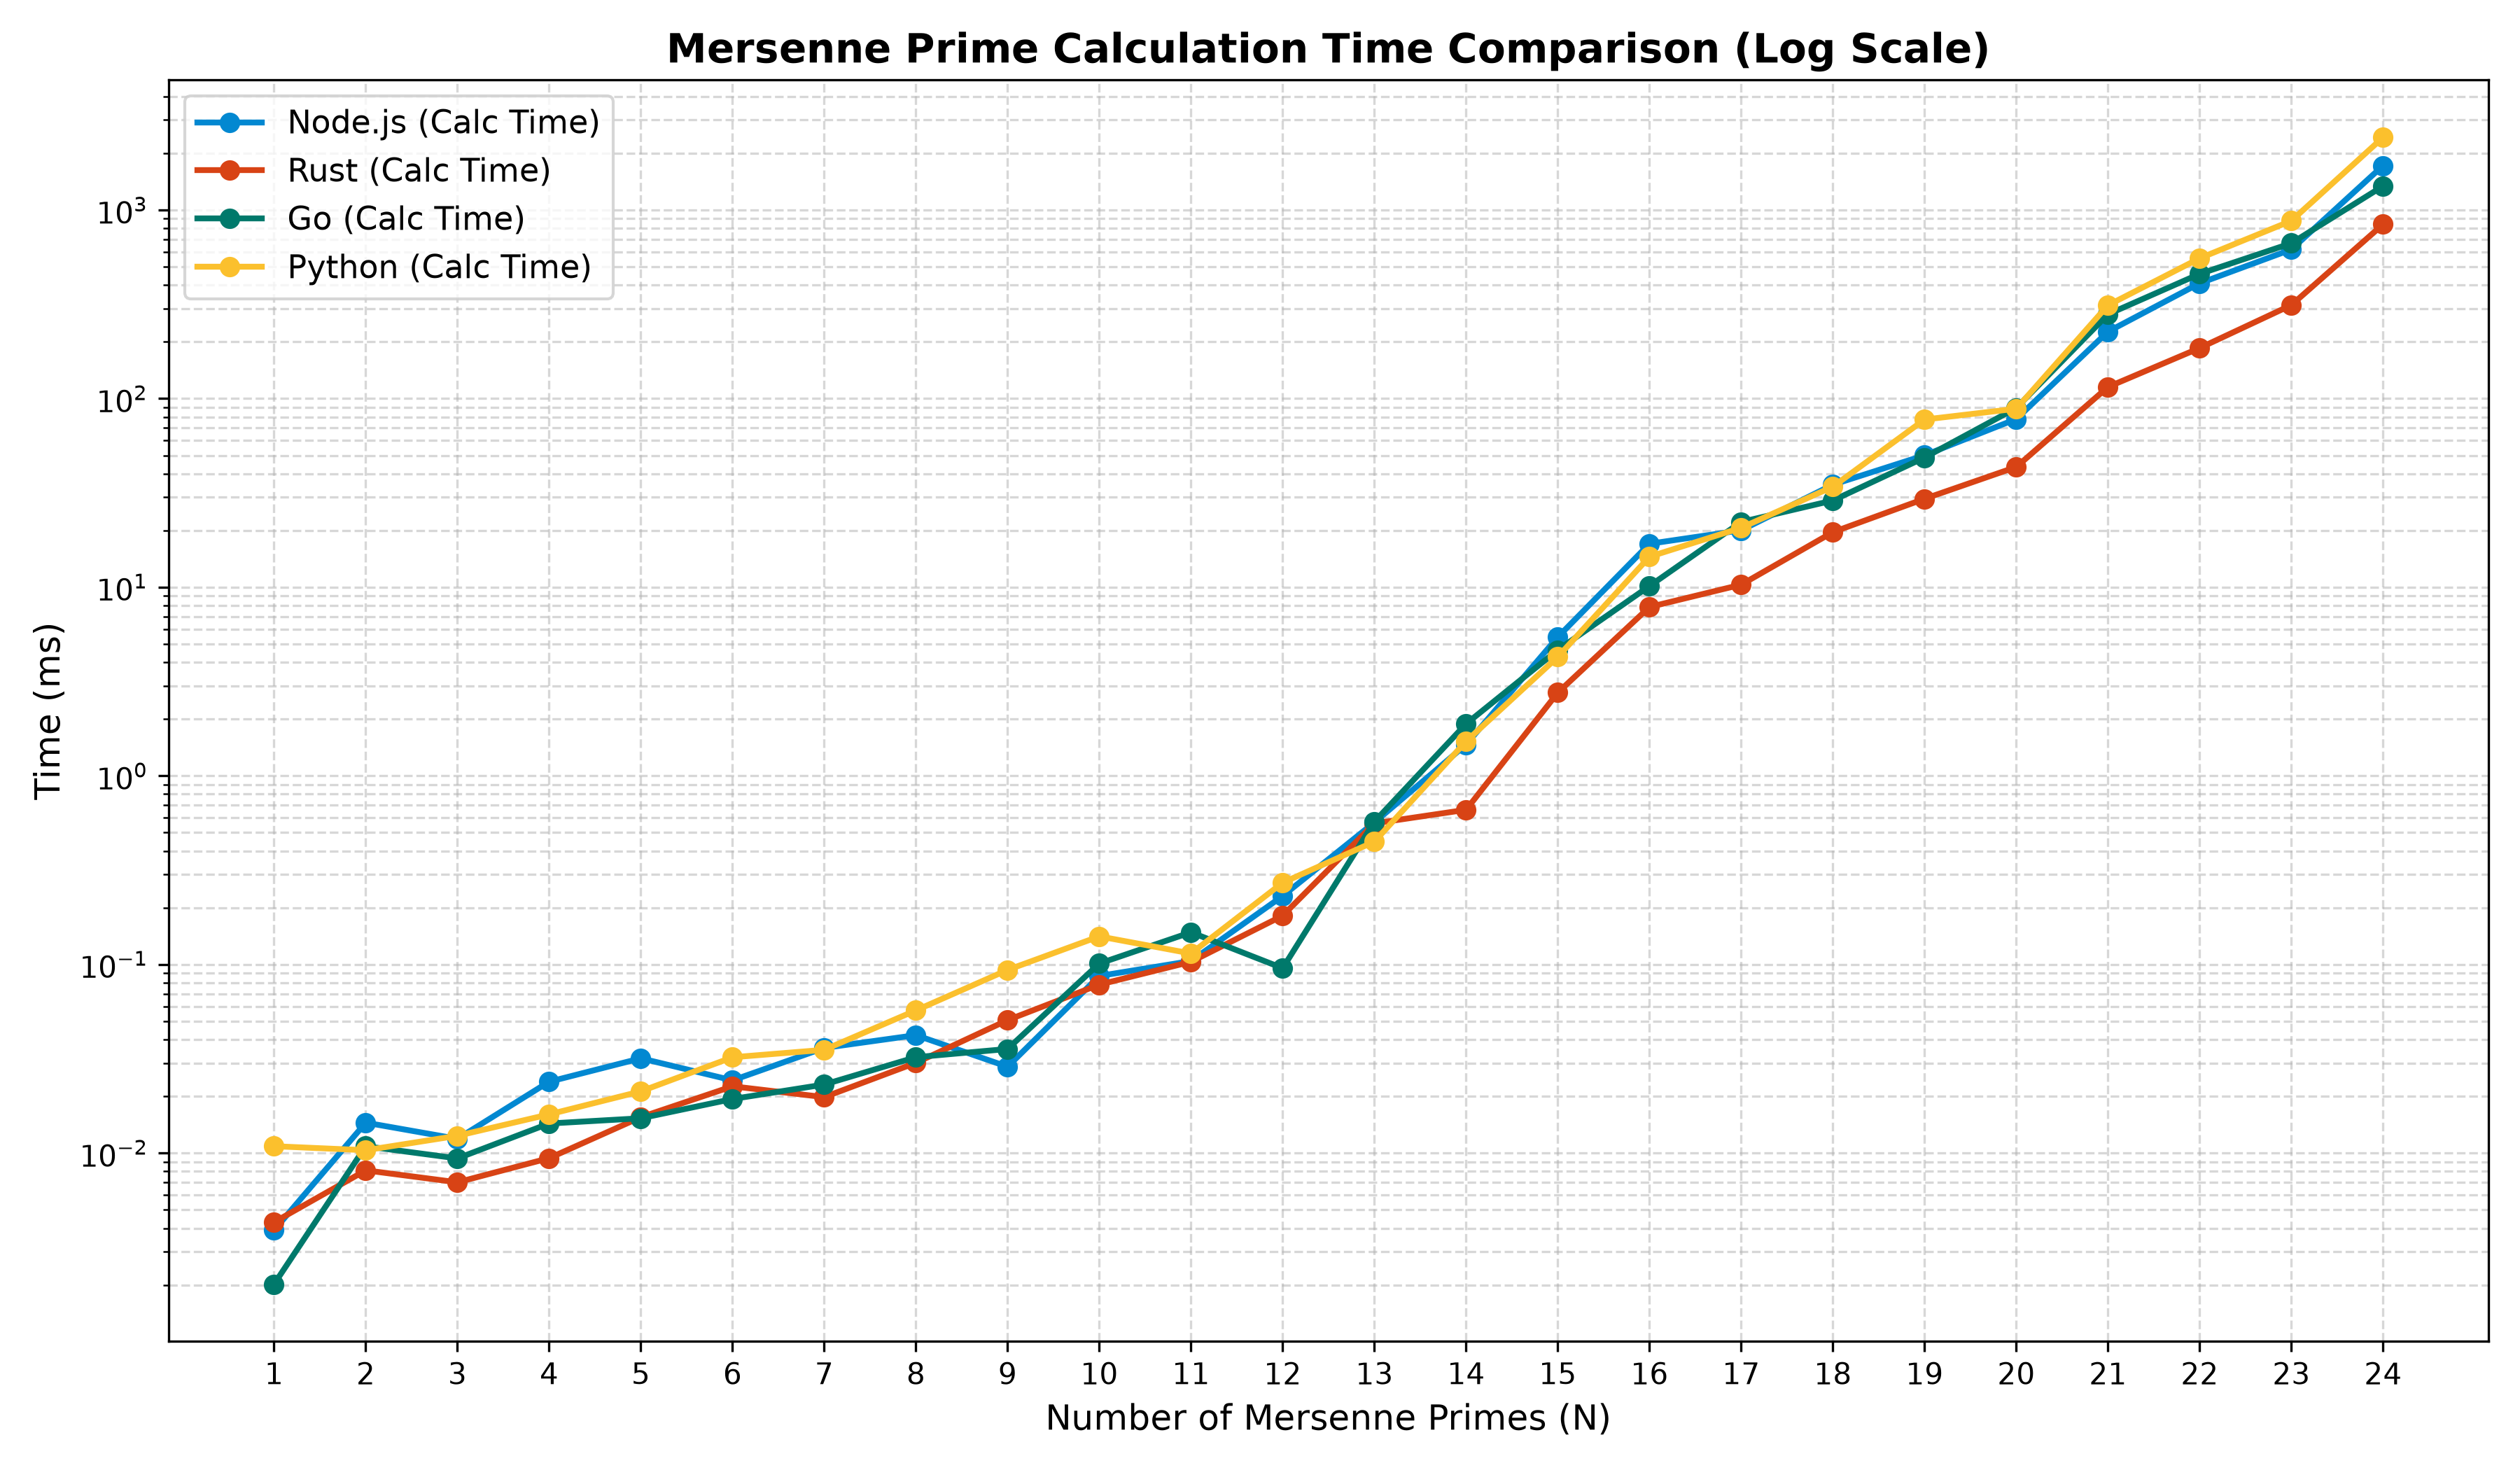
a2a-benchmark is my multi-language A2A (Agent-to-Agent) performance suite: four agents — Python and Go behind Gemini tool-calling via ADK, Node.js and Rust as direct handlers — each compute Mersenne primes with the Lucas–Lehmer test, while a harness sweeps N=1–24 and charts calculation time and round-trip time.
The committed results stopped at N=22. I never questioned that. I should have.
The headline bug: a whole column of data didn't exist
CPython 3.11+ limits int→str conversion to 4,300 digits by default (a DoS mitigation). My Python agent stringified each prime it found:
mersenne_primes.append(str((1 << p) - 1))
The 24th Mersenne exponent is p=19937, and 2^19937−1 has 6,002 digits. So for any request of 24+ primes, the tool raised ValueError — and the A2A response dutifully delivered the stack-trace text instead of a result:
"text": "Exceeds the limit (4300 digits) for integer string conversion;
         use sys.set_int_max_str_digits() to increase the limit"
The benchmark's Python column was structurally incapable of producing data at N≥24. The kicker: the stringified list was never used. The tool returns only elapsed_time. The fix is deleting the str() — which also removes formatting work from the timed region that the Node and Rust agents never paid (Go had the same dead val.String() call).
Fix: PR #1 — plus a switch from time.time() (wall clock, non-monotonic) to time.perf_counter(), and a regression test at count=24.
Before/after, N=24 row:
| Node.js | Rust | Go | Python | |
|---|---|---|---|---|
| before | 1633.01 ms | 812.57 ms | 1451.49 ms | N/A (crash) |
| after | 1616.13 ms | 824.10 ms | 1531.10 ms | 2425.9 ms |
The harness was reading its data from LLM prose
The Python agent's timing came back in two places: a structured elapsed_time in the tool artifact, and the model's prose. The harness regexed the prose first:
m = re.search(r"It took ([\d\.\-e]+) seconds", text)
In live runs, Gemini said "Calculating the first 5 Mersenne primes took 4.9591064453125e-05 seconds." one time and "The calculation took 2.40715261301375 seconds." the next. Neither matches "It took". Every datapoint survived only because a fallback happened to dig out the structured value. Measurement data should never depend on how an LLM felt like phrasing a sentence.
Meanwhile Node and Rust reported elapsed.toFixed(2) ms — so sub-10µs runs returned 0.00ms, which parses to 0.0 and silently vanishes from a log-scale chart.
Fix: PR #2 — structured artifact first, prose as last resort; 4-decimal timing output.
The agents lied about what they computed
The exponent table has 26 entries, but both direct agents echoed the requested count:
$ curl ... "Calculate the first 100 Mersenne primes"
node: "Found first 100 Mersenne primes in 4450.78ms."   # computed 26
rust: "Found first 100 Mersenne primes in 2160.45ms."   # computed 26
Fix: PR #3 — report primes.length / primes.len().
The chart compared two different universes
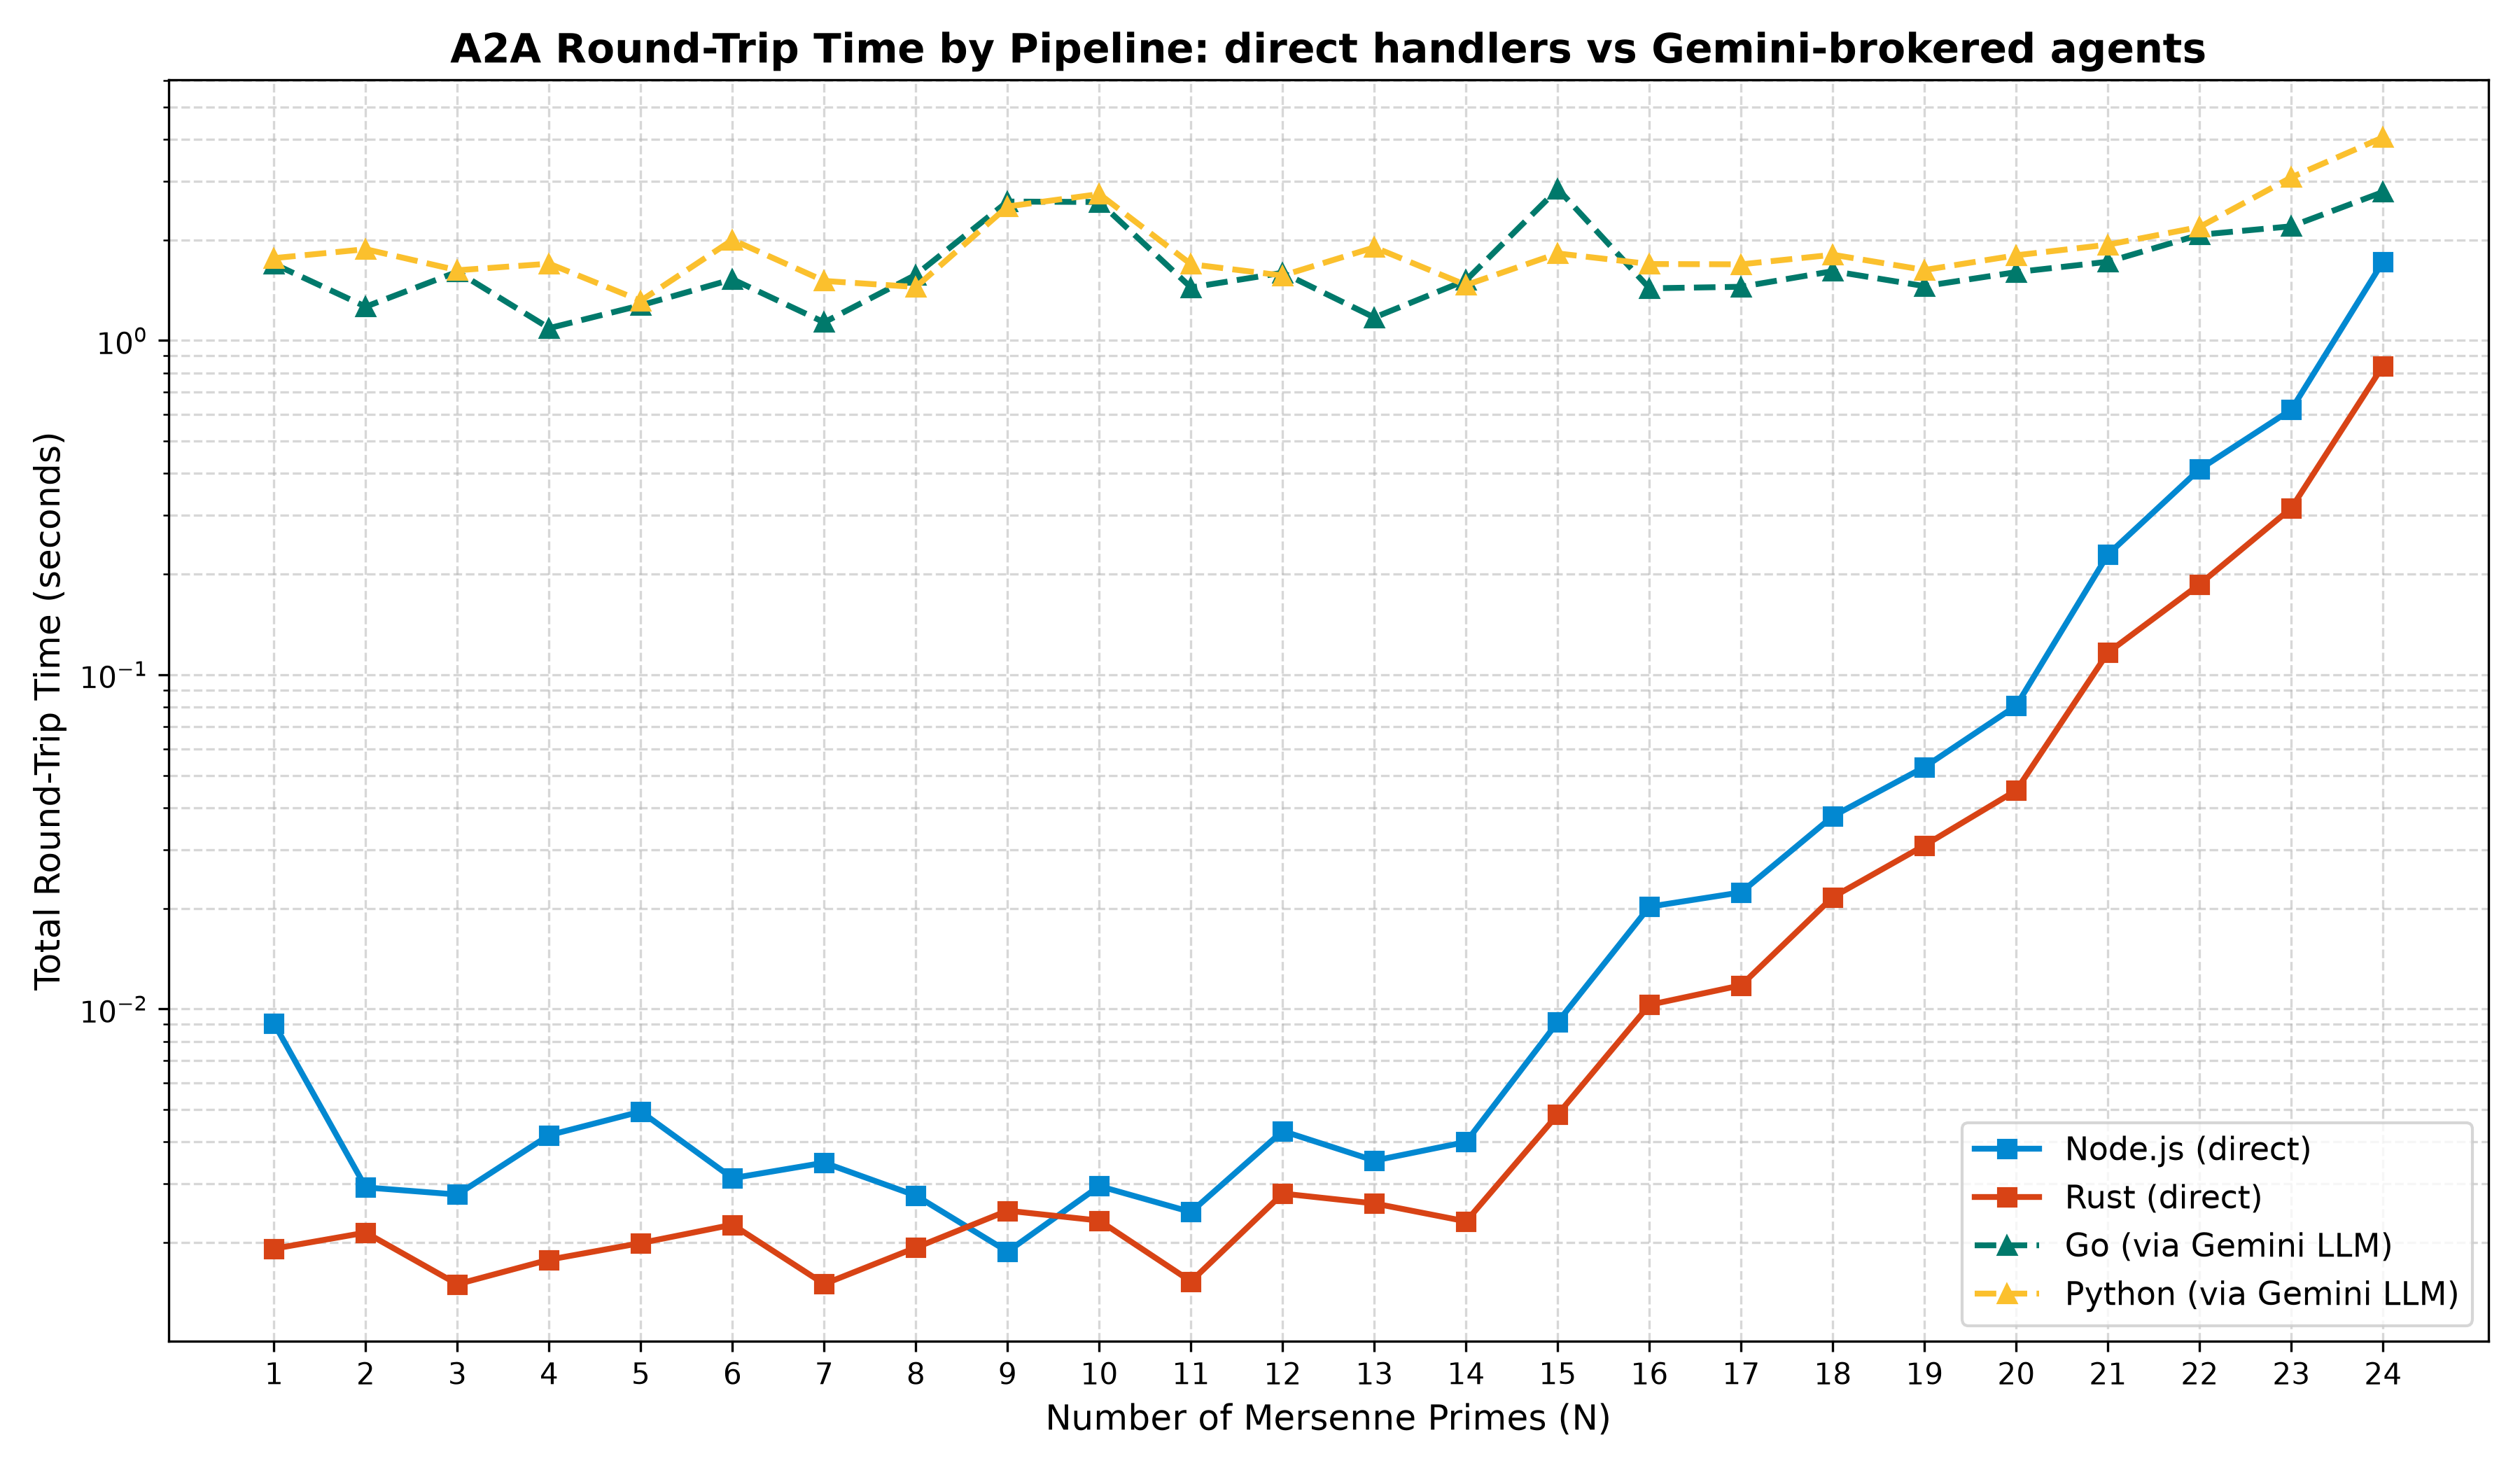
Python and Go requests route through Gemini tool-calling; Node and Rust regex the number out of the message and compute directly. The RTT chart presented all four as one comparison "including LLM/Tool calling" — true for exactly half the lines. Median RTT: Rust 2.6ms, Node 4.6ms vs Go ~1.6s, Python ~1.8s. That ~400× gap is pipeline architecture, not language performance.
Fix: PR #4 — agents tagged by pipeline; the chart renders direct vs via Gemini LLM as distinct series on a log scale, with a title that says what's actually compared.
Validation found two more (my favorites)
The fix made the code too fast for its own benchmark. With formatting removed from Go's timed region, small-N runs dropped under a microsecond — and Go's time.Duration started printing 836ns, a suffix the harness parser had never seen. The datapoint silently became N/A. One more parser branch fixed it.
Gemini refused to repeat itself. My harness reused deterministic contextIds, and ADK keeps per-context session history. On a rerun, the model answered "I already did that. Do you want to do it again?" — without calling the tool. Three datapoints gone. Benchmark IDs are now unique per run.
Result
96/96 datapoints, up from a baseline where one language column crashed, small-N values were unplottable zeros, and two datapoints per rerun depended on an LLM's patience. Nine bugs, four PRs, one afternoon of reproduction scripts — all archived with before/after charts.
Reproduce the whole thing yourself — the image builds all four fixed agents and runs the full sweep:
docker run --rm -e GEMINI_API_KEY=your_key -v "$PWD/out:/out" xbill9/bugsmash
How Google AI fit in
The suite runs on ADK + gemini-2.5-flash tool-calling end to end. Two hard-won lessons for anyone building Gemini agents: read structured tool artifacts, never model prose, when a machine consumes the output — and never reuse context IDs for independent requests unless you want session memory changing your results.
Disclosure: I used Claude Code as the debugging/automation agent for this work — it reproduced each bug, wrote the fixes and regression tests, and ran the before/after benchmark sweeps. Every bug, number, and PR above is real and verifiable in the repo.
Comments
More Blog
View allgemmaFive Gemma-4 models, one accelerator: what porting E2B 31B to AWS Inferentia2 taught me
I ported the whole Gemma-4 family — E2B, E4B, 12B, 31B, and the 26B-A4B MoE — to run on...
X
xbillcommunityHey DEV, I'm Tobore. Let's actually connect.
Hey DEV, I'm Tobore. Let's actually connect. I've been on here for a while now, mostly writing and...
L
Laurina AyarahaiI burned through thousands of AI tokens. Then a friend did it for free
(yep, kinda clickbait, just for the funsies 😊) At the beginning of the year, I relaunched my...
P
Paulo HenriqueaiClaude might be saturating your machine
My laptop was sitting idle with the fan at full tilt. Nothing was running that I knew of. The culprit...
S
Sidhant PandagithubactionsAutomated GitHub Code Reviews Using Google Gemini
I Built a Thing! TL;DR — Google Gemini-based Pull Request reviews and Issue Triaging for...
D
Darren "Dazbo" LesteraiWhat is an "agentic harness," actually?
I've been hearing the word "harness" thrown around a lot lately. I assumed it just meant "the IDE" or...
T
Tilde A. ThuriumReady-made automations for this
Workflows from the Neura Market marketplace related to this Midjourney resource
- Create Animated Stories Using GP-4.0-mini, Midjourney, Kling, and Creatomate APIn8n · $24.99 · Related topic
- Automate LinkedIn Profile Discovery and Outreach via Form Submissionn8n · $14.99 · Related topic
- Automate Midjourney Image Creation and Upscaling via Telegramn8n · $14.99 · Related topic
- Automate Graphic Wallpaper Creation with Midjourney and Canvas APIsn8n · $9.99 · Related topic