
Back to Blog gitlab
 gemma
gemma community
 ai
ai ai
ai githubactions
 ai
ai
Understanding Gitaly and Kernel Memory Consumption in Kubernetes on Self-Hosted GitLab
Camila February 24, 2026
0 views
During the early hours of the morning, I started receiving Gitaly alerts — memory spikes that weren't...
During the early hours of the morning, I started receiving Gitaly alerts — memory spikes that weren't being released automatically after the daily backup.
This article is about a self-hosted GitLab on EKS and the behavior of some GitLab components in Kubernetes.
If you also run GitLab on Kubernetes, it's worth understanding what's really happening — and why Cgroup v2 is the definitive solution to this kind of problem.
GITALY
Gitaly is the GitLab component responsible for all Git operations: clone, push, pull, merge, diff, and blame. It isolates repository storage from the web application and communicates with other services via gRPC, optimizing performance and concurrency control.
┌─────────────────────┐
│ GitLab Webservice   │
│              │
└──────────┬──────────┘
           │ gRPC
           ↓
┌─────────────────────┐
│ Gitaly              │
│ - Git operations    │
│ - Repository access │
└──────────┬──────────┘
           ↓
┌─────────────────────┐
│ Persistent Volume   │
│ /home/git/repos     │
└─────────────────────┘
GITLAB TOOLBOX BACKUP
It's a GitLab component used to perform backups in Kubernetes environments (specifically deployed using Helm charts). It's a pod/container that contains tools and scripts to execute GitLab backup and restore operations. When does it interact with Gitaly? During repository backups.
- Connects to Gitaly via gRPC
- Requests a backup of each repository
- Receives Git bundles from Gitaly
- Processes and compresses the data
- Sends everything to object storage (S3, GCS, etc.)
During the execution of the gitlab-toolbox-backup cronjob in the early morning, I observed high memory usage on the Gitaly pod. This consumption is caused by the default behavior of the Linux kernel, which uses RAM as a cache for files read from disk (page cache).
In Kubernetes environments, this behavior can create resource allocation problems, since the kernel is shared across all pods on the node.
Symptoms:
High memory usage


Critical implications:
- The kernel is shared across the entire node
- Page Cache is global and shared
- Cgroups v1 only limits how much each container can use
- The kernel has no concept of "pod" or "container" — if the node has plenty of RAM, the kernel considers memory available even when a pod is about to be OOM-killed.
┌─────────────────────────────────────────────────┐
│                     NODE                        │
│                                                 │
│  ┌──────────────────────────────────────────┐   │
│  │         LINUX KERNEL (single)            │   │
│  │  - Manages ALL node RAM                  │   │
│  │  - Page Cache is SHARED                  │   │
│  │  - Has no concept of "pod"               │   │
│  └──────────────────────────────────────────┘   │
│                                                 │
│  ┌────────────┐  ┌────────────┐  ┌──────────┐   │
│  │  Pod A     │  │  Pod B     │  │  Pod C   │   │
│  │  (Gitaly)  │  │  (Redis)   │  │  (Web)   │   │
│  │            │  │            │  │          │   │
│  │  Sees:     │  │  Sees:     │  │  Sees:   │   │
│  │  Limit:8GB │  │  Limit:4GB │  │ Limit:2GB│   │
│  └────────────┘  └────────────┘  └──────────┘   │
│                                                 │
│  Total RAM: 32GB                                │
│  Total Cache: 20GB (visible to ALL)             │
└─────────────────────────────────────────────────┘
Note: Page Cache is the RAM used by the kernel to cache files from disk.
Backup Flow
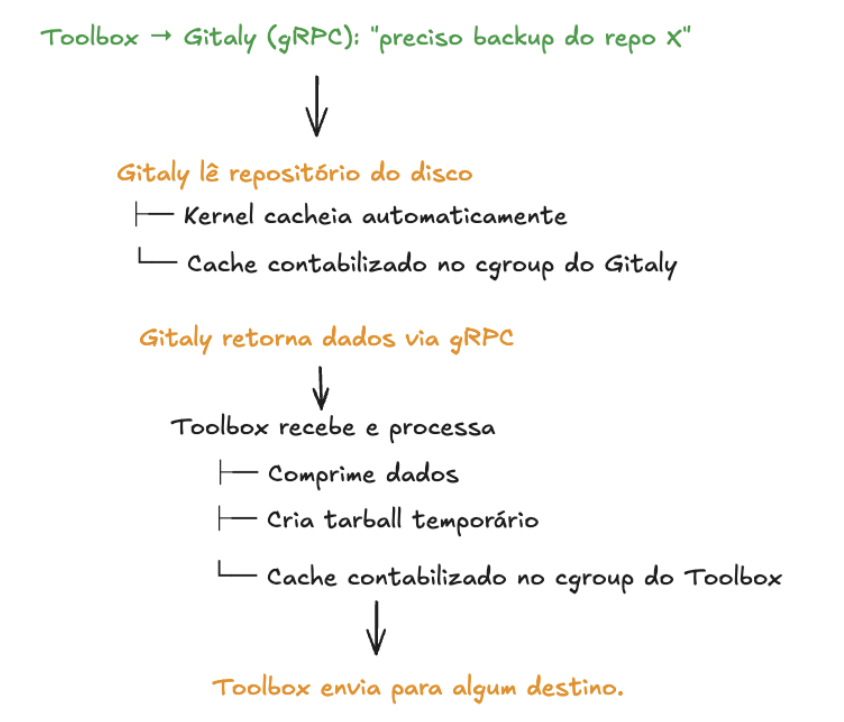
What happens?
During the backup (1h):
- Gitaly reads hundreds of Git repositories
- Kernel caches everything: "I'll keep these .git files in RAM"
- Backup ends: Gitaly process returns to normal (195MB)
- Kernel doesn't clean up: Cache stays marked as "active_file" = 35.6GB
- Kubernetes sees: Pod using 37GB → OOM danger!
Why doesn't it clean up automatically?
The cache is marked as "active" (not "inactive"), so the kernel thinks:
"These files were recently used" "They'll probably be used again soon" "I'll keep them in RAM"
But since this is a backup that runs once a day, those files won't be accessed again until tomorrow!
Possible solutions evaluated:
| Option | Effort | Benefit | Recommendation |
|---|---|---|---|
| Migrate to cgroup v2 | High (node reboot) | Definitive fix | Best long-term option |
| Privileged CronJob to drop cache | Low (15min) | Solves the problem | If you need a quick fix |
| DaemonSet monitor | Medium (1h) | Automated | Optional |
| Increase memory limit | Low | Temporary workaround | Emergency only |
As we can see, there are workarounds — but the best long-term option is Cgroup v2. It requires a bit more effort to implement, but the benefits make it stand out.
Current Cgroup v1 data:
cache: 38829035520           # 36.2 GB !!!!!
rss: 204779520               # 195 MB
inactive_file: 568246272     # 542 MB
active_file: 38260654080     # 35.6 GB !!!!!


**35.6GB of `active_file`** = actively cached files (page cache)!

Breakdown:
- Gitaly process (RSS): 195 MB
- Active file cache: 35.6 GB  ← HERE!
- Inactive file cache: 542 MB
- Total cache: 36.2 GB
━━━━━━━━━━━━━━━━━━━━━━━━━━━━━━━━━
Total pod usage: ~37 GB
Cgroup v2
Cgroup v2 has a feature called PSI that detects when there is memory "pressure":
# cgroup v2 exposes:
/sys/fs/cgroup/memory.pressure
# Content:
some avg10=0.00 avg60=0.00 avg300=0.00 total=0
full avg10=0.00 avg60=0.00 avg300=0.00 total=0
When pressure is detected, the kernel automatically releases cache even if it's marked as "active"!
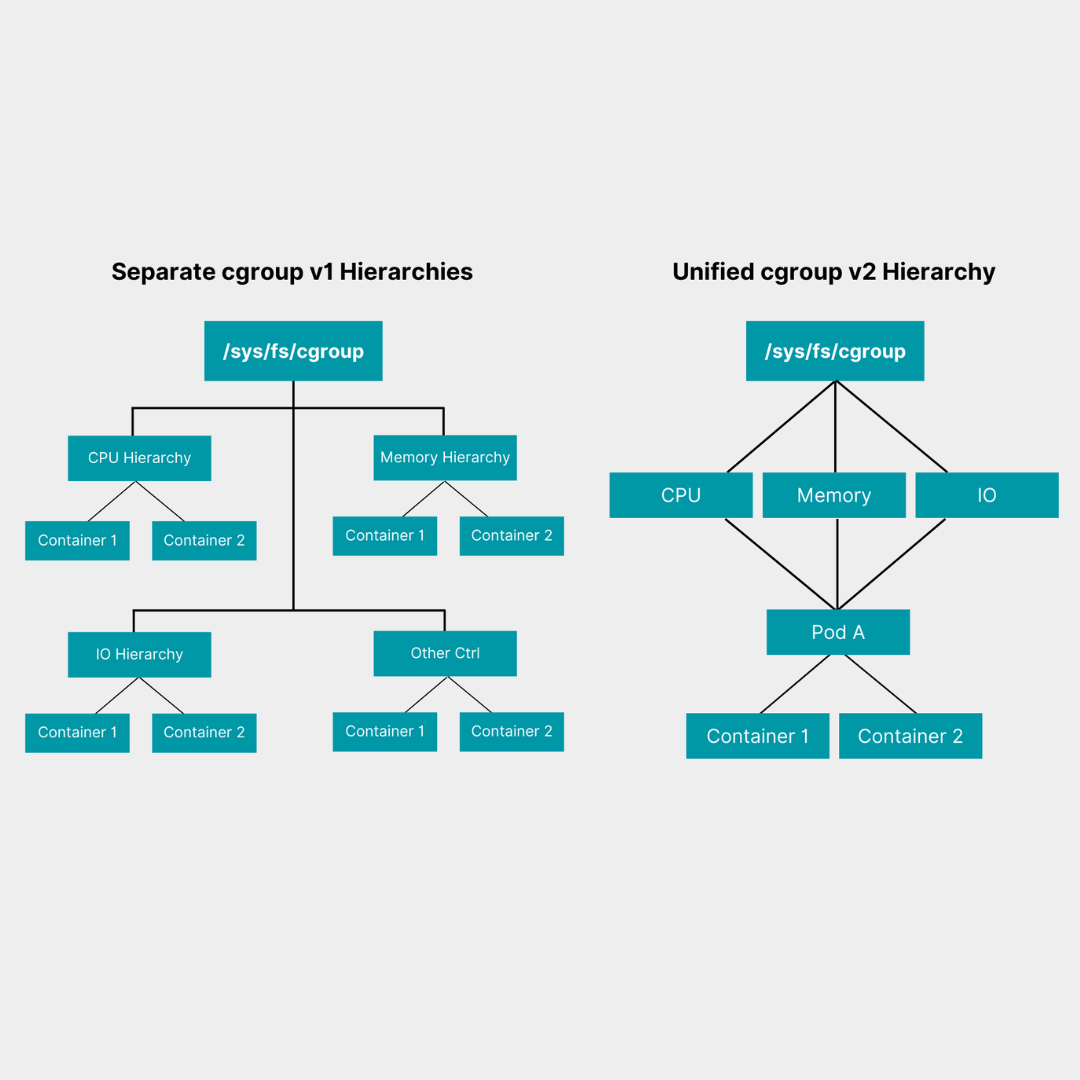
Cgroup v2 is the second generation of the Linux kernel's control groups system, with significant improvements over v1. Our GitLab EKS cluster is currently running Cgroup v1.
Cgroup v1 has multiple independent hierarchies (memory, cpu, io), which can cause inconsistencies. Cgroup v2 uses a single unified tree:
That's it! I had the chance to dig into this topic this week and wanted to share what I learned.
Docs: backup-restore Kernel Tuning and Optimization for Kubernetes: A Guide Linux Kernel Version Requirements
Comments
More Blog
View allgemmaFive Gemma-4 models, one accelerator: what porting E2B 31B to AWS Inferentia2 taught me
I ported the whole Gemma-4 family — E2B, E4B, 12B, 31B, and the 26B-A4B MoE — to run on...
X
xbillcommunityHey DEV, I'm Tobore. Let's actually connect.
Hey DEV, I'm Tobore. Let's actually connect. I've been on here for a while now, mostly writing and...
L
Laurina AyarahaiI burned through thousands of AI tokens. Then a friend did it for free
(yep, kinda clickbait, just for the funsies 😊) At the beginning of the year, I relaunched my...
P
Paulo HenriqueaiClaude might be saturating your machine
My laptop was sitting idle with the fan at full tilt. Nothing was running that I knew of. The culprit...
S
Sidhant PandagithubactionsAutomated GitHub Code Reviews Using Google Gemini
I Built a Thing! TL;DR — Google Gemini-based Pull Request reviews and Issue Triaging for...
D
Darren "Dazbo" LesteraiWhat is an "agentic harness," actually?
I've been hearing the word "harness" thrown around a lot lately. I assumed it just meant "the IDE" or...
T
Tilde A. ThuriumReady-made automations for this
Workflows from the Neura Market marketplace related to this DeepSeek resource
- Automate Kubernetes CPU Spike Alerts from Prometheus to Slackn8n · $9.99 · Related topic
- Kubernetes RCA and Alerting Using Gemini, Loki, Prometheus, Slackn8n · $24.99 · Related topic
- Automated Water Consumption Tracker - Stored in Sheet and Notify in Slackn8n · $14.99 · Related topic
- Parse Incoming Invoices from Outlook Using AI Document Understandingn8n · $14.99 · Related topic